
Can a better user experience fundamentally change the accuracy of an oil and gas organization’s forecasting? My delivery team and I proved it can. Discover how we harnessed the power of user-centered design to transform a complex tool into an intuitive asset, driving more accurate predictions and empowering better business outcomes.
CHANNELS:
DESKTOP APPLICATION
ROLE:
CREATIVE LEAD
MY TEAM:
2 UX DESIGNER | UX RESEARCHER |
3 VISUAL DESIGNERS
A Fragmented, Inefficient System
At one of the world’s largest oil and gas companies, workforce forecasting was a complex and disjointed process. Critical staffing data was scattered across multiple systems making it difficult for leadership to anticipate project needs. Teams struggled with inconsistent data, siloed information, and last-minute staffing gaps; all issues that slowed down global operations and impacted business outcomes.
CapEx (Capital Expenditure) and OpEx (Operational Expenditure) were reaching 10 – 100 million each year
Inaccurate resource predictions in oil and gas can waste billions. Even a small yearly overestimation of spending can lead to millions lost on unnecessary drilling. Wrong predictions about resources or production can cause overspending, unused equipment, safety risks for workers, and lost opportunities.
Poor resource predictions in oil and gas lead to major money problems.
- Wasted Investments: We might spend too much on projects that don’t pan out because we guessed wrong on resources. This means unused equipment and big losses. We could also build too much or too little infrastructure (pipelines, storage), wasting money either way.
- Lost Sales: If our predictions are off, we miss chances to profit from new resources or expand. We also can’t meet customer demand if we underestimate how much we can produce, losing sales and market share.
- Higher Costs & Downtime: Wrong forecasts cause unexpected shutdowns, costing millions. We also waste money on fuel, labor, and other operations because we didn’t plan well.
Basically, bad forecasting means big financial hits through wasted investments, lost sales, and higher operating costs. The exact cost depends on the project size and how wrong our predictions are.
As a Creative Lead, my delivery team and I were assigned an opportunity to redefine resource forecasting by creating a unified platform that would give leadership real-time insights, predictive analytics, and greater control over workforce planning.
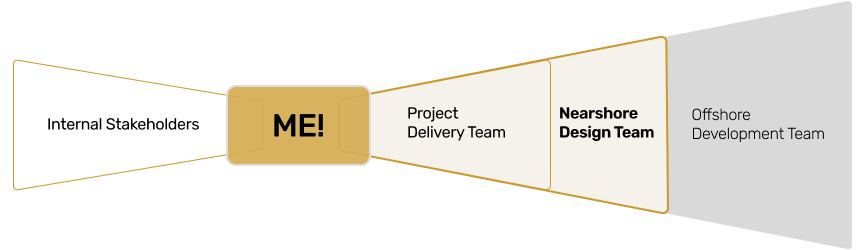
Team topology consisted of internal stakeholders as subject matter experts and proxy users, myself, project manager along with onshore business analysts, nearshore design team, and offshore development team.
Finding Insights Without Direct field management Access
A major challenge was limited access to end users due to geographic constraints. Instead of letting this slow us down, I turned to proxy user workshops, working closely with internal stakeholders who mirrored our target audience. These sessions helped us:
Map out existing workflows and identify pain points.
Uncover inefficiencies in decision-making processes.
Define key user needs, ensuring that our design approach was truly human-centered.
From Complexity to Clarity: Redesigning the System
With a clearer understanding of the problem, my team conducted a deep-dive through heuristic analysis across five disconnected systems, uncovering bottlenecks that slowed decision-making. Using these insights, we streamlined data structures to eliminate redundancy, designed API integrations to connect siloed information, and created a centralized, real-time view of workforce availability—transforming efficiency and decision-making.
These insights became the foundation for a smarter, more intuitive workforce planning solution. Without direct user access, we embraced a culture of rapid experimentation.
My team mapped user flows to highlight inefficiencies, align teams, and identify opportunities for streamlining workforce planning. Scenario-based reviews fostered collaboration and ensured solutions addressed real operational challenges.
We created interactive wireframes to simulate workforce allocation scenarios, enabling stakeholders to identify bottlenecks and optimize staffing decisions. Conducted impression testing to gather early feedback, ensuring clarity, usability, and alignment with real-world workforce planning needs.
My team developed functional prototypes that integrated real-time data insights with intuitive visual cues, enabling users to quickly assess workforce availability and resource gaps. Iteratively refined designs based on user feedback, ensuring seamless interaction, clarity in decision-making, and alignment with business objectives.
Prototype Testing: Nested Resource Selection Pattern
Video depicts a recording of a stakeholder interacting with Miller Column design to select nested resource features for creating resource group for forecasting (we only had access to historical data, over 5 years old, due to content sensitivity). This was one of four iterations and interaction patterns tested in the project.
Design for usability, and designed for visual impact
Our iterative process sped up validation, refined designs with feedback, and accelerated development. We future-proofed the platform by expanding the enterprise design system with new patterns for large-scale forecasting and resource management, ensuring adaptability to changing workforce and business needs. To improve forecast accuracy, we integrated advanced analytics and an intuitive UI, including predictive modeling for early skill shortage detection, algorithms for optimal resource allocation during peak times, and anomaly detection for global consistency. Simplified workforce requests further cut manual work, giving leadership proactive tools to manage workforce demands.
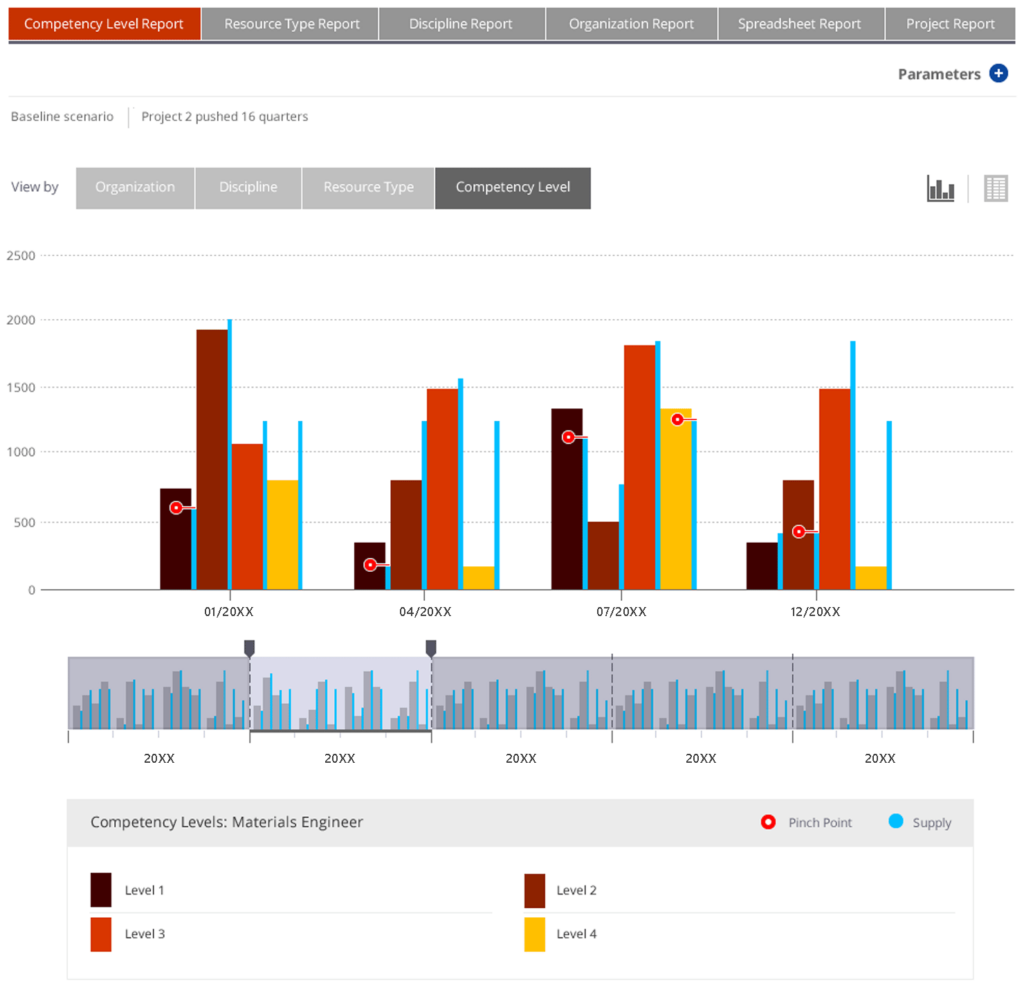
Sample screenshot displays resource competency level across available resources.
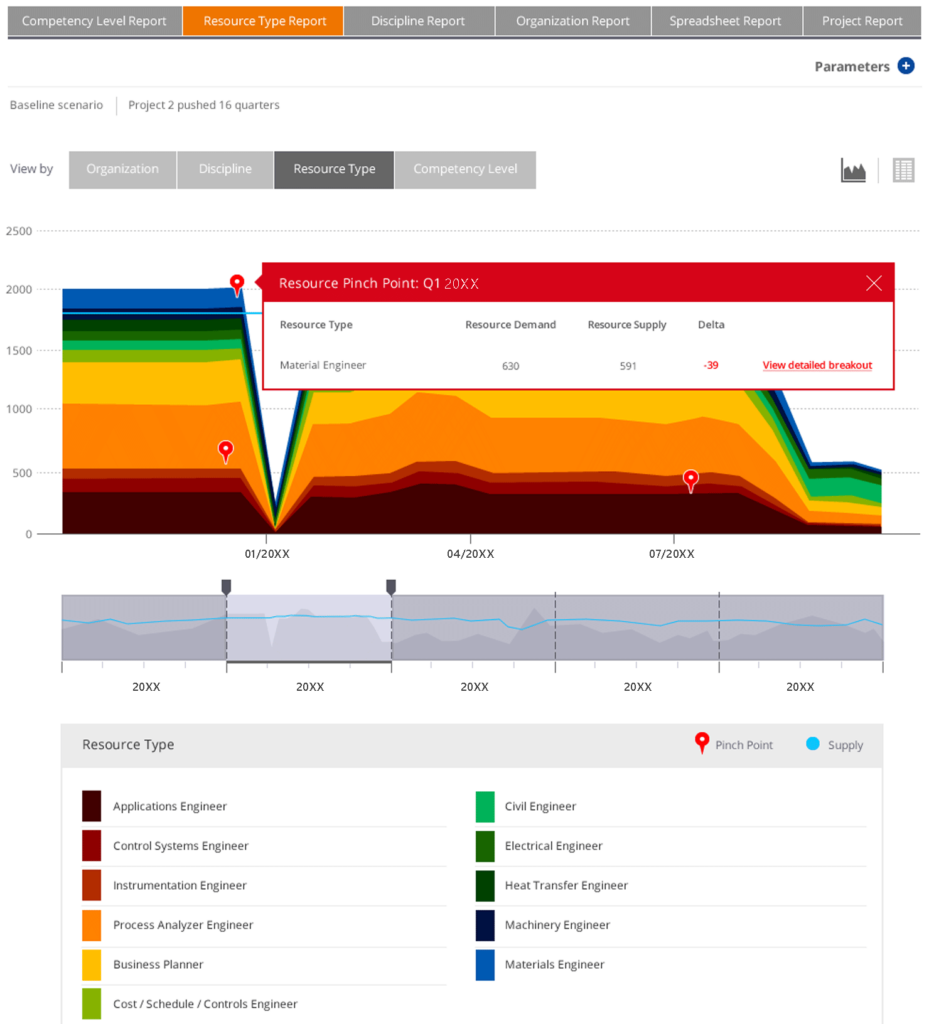
Sample screenshot displays resource type across volume of available resources.
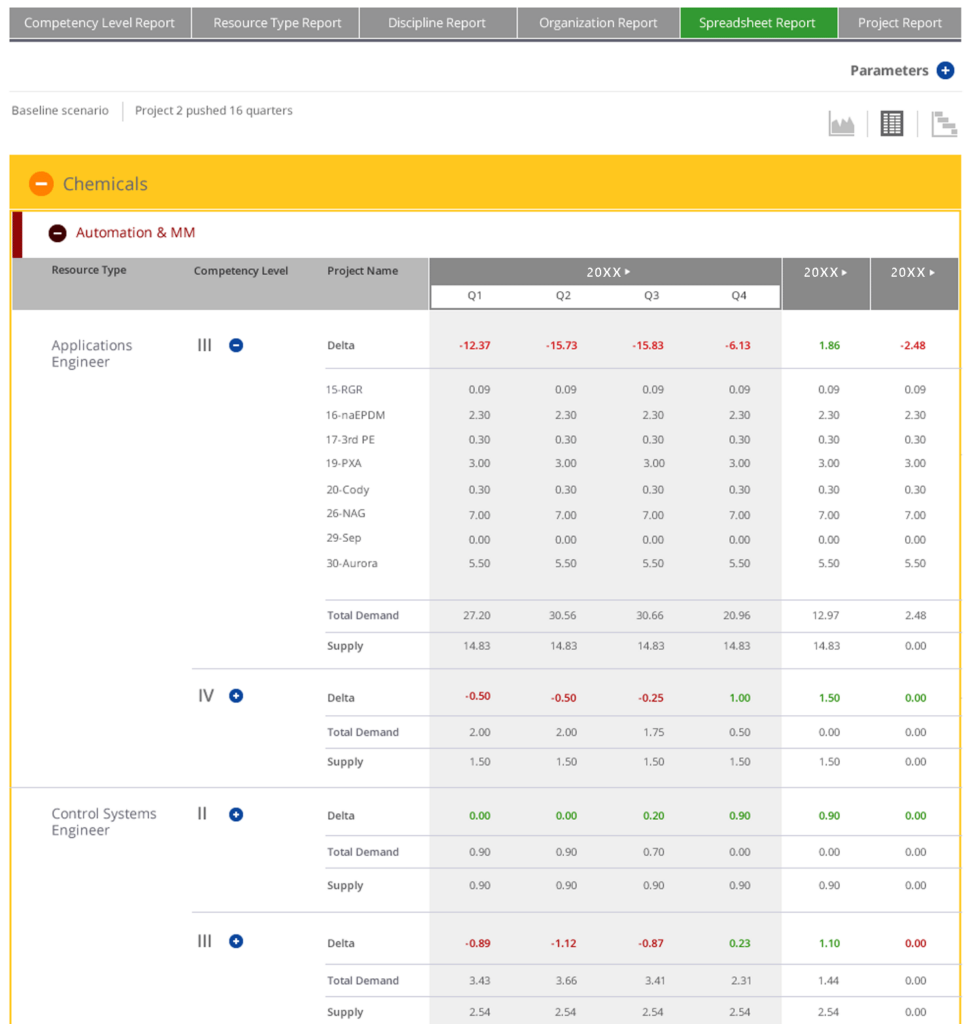
Sample screenshot displays resource supply and demand matrix.
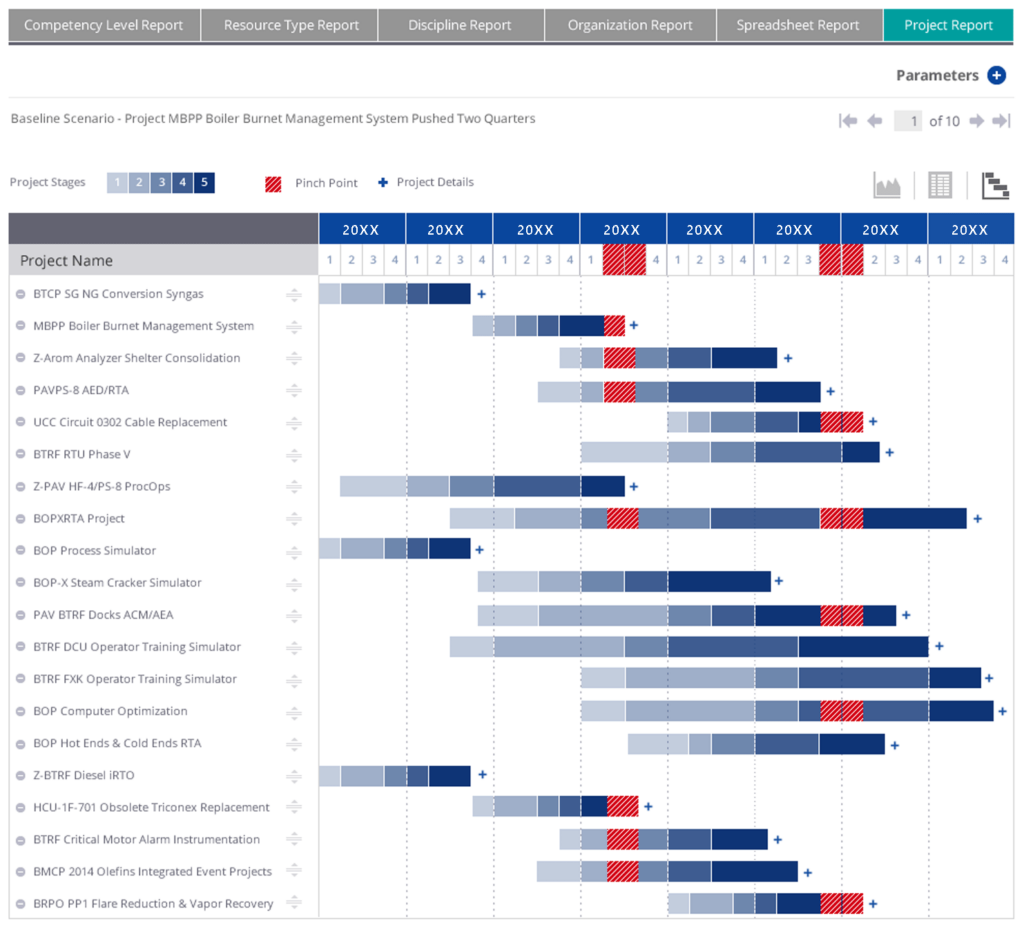
Sample screenshot displays projects per portfolio and resource constraints in a Gantt chart format.
Measurable Business Impact: UX Drives WORKFORCE VALUE
percent faster resourcing decisions, enabling agility in responding to shifting project demands
Redesigning workforce forecasting for usability and efficiency drove measurable impact. Optimized staffing and predictive planning empowered managers as key business drivers while reducing manual effort. Key outcomes came in these areas:
- Reduced misallocations with optimized staffing recommendations
- Accelerated scenario planning for real-time workforce visibility
- Shifted focus to strategy by minimizing manual data reconciliation
- Enhanced market competitiveness through stronger project bids and resource commitments

Lessons IN DESIGN Leadership: EMPOWERING Business Transformation
This initiative wasn’t just about improving an interface—it transformed how a global organization anticipates, allocates, and optimizes its workforce. Major insights and outcomes:
By applying human-centered design to resource forecasting, we eliminated inefficiencies while empowering leadership with smarter decision-making tools and increased agility in workforce planning. Proving that UX isn’t just about design, it’s about shaping the future of business strategy.
CHECK OUT THESE OTHER CASE STUDIES, SCENARIOS, and stories
Training healthcare IT teams with people experiences in mind.

Streamlining transaction settlements through design governance.

Optimizing supply chain data entry through user feedback at a global scale.

Educating marketers to better communicate energy efficiency to customers.